
The Global Coffee Bean Journey
Coffee is a beloved beverage enjoyed by billions worldwide. The path those beans take from cultivation to your cup is a complex and fascinating journey that spans continents. Let’s explore the intricate steps involved in getting coffee from farm to cup, highlighting the various stages of production and global trade.

Data-Driven Journey: A Global Affair
According to the USDA Foreign Agricultural Service, Brazil remains the world's leading coffee producer at 39% of global production, followed by Vietnam at 16% and Colombia at 7% respectively. In 2023/2024, Brazil is expected to dominate coffee exports on the world market, producing over 3.9 billion kilograms of coffee.
From Seed to Cherry: Cultivation in the Coffee Belt
The process starts in the fertile regions known as the "Coffee Belt," a swathe of land around the equator with ideal growing conditions. Major coffee-producing countries like Brazil, Colombia, Ethiopia, Vietnam, and Indonesia dominate this belt. Here, coffee is cultivated on farms that range from small, family-owned plots to sprawling estates.
The journey begins with tiny coffee seeds being carefully nurtured in shaded nurseries. These seedlings are transplanted to dedicated fields where they mature into coffee trees. These trees produce beautiful white flowers that eventually transform into coffee cherries, each containing two coffee beans.
The Art of Picking: Selective Harvesting
Harvesting coffee cherries is a crucial step. Ideally, only ripe cherries are picked, as they boast the most complex flavors. Two main methods prevail: strip picking, where all cherries are collected regardless of ripeness (often used for large-scale production), and selective picking, where only ripe cherries are meticulously hand-collected (favored for higher-quality coffee).
Processing the Beans: From Cherry to Green Coffee
Once harvested, the cherries need processing to remove the fruit flesh and liberate the coffee beans. There are three main processing methods:
Washed: This method involves soaking cherries in water and using a machine called a de-pulper to remove the skin and fleshy parts of the fruit before drying the beans. Washed coffee is known for its clean and bright flavors.
Natural: Here, cherries are dried whole under the sun. Once fully dried, the skin and dried fruit flesh is removed, with the fruit flesh imparting a unique sweetness and fruitiness to the beans.
Honey: This falls between washed and natural, where some fruit flesh is left on the beans during drying, leading to a complex flavor profile.
Once the processing stage is complete, the coffee beans undergo further refinement. First, they are hulled, which means the tough outer parchment layer that surrounded them during drying is removed. This reveals the green coffee bean we're familiar with. Some beans may then be polished to remove any remaining trace of the parchment or silver skin, resulting in a smoother, more uniform appearance. Finally, the beans are meticulously graded and sorted based on several key factors. Size, density, and visual quality are all carefully assessed to ensure only the best beans make it to the next stage – roasting – where their unique flavors and aromas will be developed.
Global Transit: The Long Journey to Roasters
Green coffee beans then embark on a long journey, often by sea, to reach roasters worldwide. Major shipping hubs like Santos in Brazil and Mombasa in Kenya play a vital role in facilitating the global coffee trade.
The Transformation: Roasting for Flavor
Once at the roaster, the green coffee beans undergo a crucial transformation. Through a carefully controlled heating process, the beans change color, develop their unique aroma and flavor profile, and lose moisture. The roast level, from light to dark, significantly impacts the final taste. Lighter roasts retain more origin characteristics, while darker roasts boast a bolder, more intense flavor.
Grinding and Brewing: The Final Steps
Roasted beans are then ground to a specific size depending on the brewing method chosen. From the classic drip coffee maker to the intricate pour-over technique, various brewing methods allow the hot water to extract the flavorful compounds from the grounds. Finally, after all these steps, you get to savor the culmination of this global journey – a delicious cup of coffee.
A Fairer Future: Sustainability and Ethical Sourcing
The global coffee bean journey is not without its challenges. Fair trade practices and sustainable farming methods are crucial considerations. Fair trade certification ensures farmers receive a fair price for their coffee, while sustainable practices promote healthy coffee ecosystems and environmental consciousness. By understanding these challenges and implementing solutions, we can ensure a thriving coffee industry for generations to come. This not only benefits coffee lovers worldwide, but also the farmers who cultivate these precious beans and the environments where they're grown.

Global Crude Oil Supply Chain
Crude oil, a liquid hydrocarbon, has fueled the world for over a century, remaining a dominant energy source. This resource travels from underground reservoirs to consumers through a complex global network.

Extraction begins deep underground where oil resides trapped in rock formations. Exploration companies utilize seismic surveys to identify promising drilling locations. Once a viable reservoir is found, drilling rigs extract the crude oil, often accompanied by natural gas. This extracted mixture requires processing before becoming the refined products we rely on.
Pipelines and tankers are the two main methods for transporting crude oil. Pipelines are the most cost-effective option for overland transport, with these massive steel tubes carrying millions of barrels per day across continents. However, pipelines have limitations: they're expensive to build and maintain, with fixed routes.
For long-distance ocean transport, massive oil tankers take center stage. Some exceed 1,000 feet in length, capable of carrying millions of barrels of crude oil. Major shipping routes cross the globe, with the Suez Canal and the Strait of Hormuz being critical chokepoints. Disruption in oil transportation in these regions impacts global prices.
Upon reaching its destination, crude oil embarks on its final leg – refining. Refineries are complex facilities that utilize various processes to transform crude oil into a variety of usable products. Gasoline, diesel, jet fuel, heating oil, and petrochemicals are just a few examples of the end products derived from crude oil.
A network of pipelines, rail lines, and trucks distribute the refined products from refineries to their final destinations. Rail cars offer an alternative for overland transport, particularly for large volumes over long distances. However, pipelines are generally preferred due to their cost-effectiveness for bulk transportation. Barges play a crucial role in transporting refined products along waterways, rivers, and canals. Gas stations receive gasoline and diesel for vehicles, while factories utilize various fuel oils and petrochemicals for industrial processes. Heating oil reaches homes and businesses for winter heating.
The global crude oil market is a complex system of supply and demand. Major producers like OPEC and individual countries like Russia and the United States influence supply by regulating production levels. On the demand side, factors like economic growth, transportation needs, and adoption of alternative energy sources play a crucial role.
Price volatility is a characteristic of the oil market. Geopolitical tensions, unexpected supply disruptions, and economic activity fluctuations can cause price changes. This has a ripple effect, impacting everything from transportation costs to consumer goods prices.
The push for cleaner energy sources like solar and wind power is gaining momentum. However, crude oil is likely to remain significant in the global energy mix for the foreseeable future.
Technological advancements in exploration, drilling, and refining aim to increase efficiency and reduce environmental impact. Additionally, there's growing interest in biofuels and carbon capture technologies that could mitigate the environmental footprint of the crude oil supply chain.
The global crude oil supply chain is a vast and complex network that sustains the world. As we move towards a more sustainable future, navigating the transition away from a reliance on crude oil will require continued innovation and international cooperation.
Sources:
Oil In Motion: How Crude Oil Transportation Works

Global Sugar Trade
Sugar, the ubiquitous sweetener, has a fascinating journey before it lands in your kitchen. Approximately 80% of the world's sugar is produced from sugarcane, stretching across fertile plains to bustling processing plants with industrial activity, the global sugar trade is a complex process of production, consumption, and international exchange. Let's dive into this intricate system, following the path of sugar from its sun-drenched origins to your cup of tea.
Sugarcane Symphony: The Powerhouse Producers
According to a report by the United States Department of Agriculture, in 2023/2024, the top sugar producing regions were Brazil, India, the European Union, China, and Thailand. Brazil exported $11.5 billion in raw sugar in 2022, making it the world’s largest exporter. Interestingly, Brazil's dominance is partly due to its ideal climate and fertile soil, allowing for multiple sugarcane harvests per year. India followed closely behind as the 2nd largest exporter of sugar at $6 billion in trade.
From Field to Factory: The Processing Powerhouse
Sugarcane undergoes a transformation in dedicated processing facilities. Here, the stalks are crushed to extract juice, which is then clarified through a multi-stage process to remove impurities. This clarified juice undergoes concentration to remove excess water, resulting in a thick syrup. The syrup is then crystallized through a controlled cooling process, forming the golden brown crystals of raw sugar. Some facilities further refine raw sugar by removing molasses, a dark, syrupy byproduct. This refining process results in the white granulated sugar familiar to most consumers. Interestingly, depending on the refining process, different types of sugar can be produced, such as brown sugar, confectioners' sugar, and caster sugar, each with its own unique properties and culinary uses.
The Global Sugar Market: A Balancing Act
The global sugar market is a complex web of supply and demand. Leading producers like Brazil often export their surplus, while major consumers like China, Indonesia, and the European Union rely on imports to meet their needs. This trade is influenced by various factors, including:
• Production Fluctuations: Weather patterns, such as droughts or floods, can significantly impact sugarcane yields, affecting global supply and prices. Additionally, disease outbreaks like sugarcane mosaic virus can also disrupt production.
• Consumption Trends: Rising disposable incomes in developing countries drive sugar consumption, particularly in processed foods and beverages. Conversely, health concerns and growing awareness of the negative health effects of excessive sugar intake can lead to decreased demand in developed nations.
• Government Policies: Government subsidies for producers can incentivize sugarcane production, impacting global supply. Additionally, import quotas and tariffs can influence the flow of sugar between countries.
The Journey Continues: Shipping Sugar Around the Globe
The main workhorses for global sugar transport are bulk carriers. These are massive ships specifically designed to haul large quantities of dry bulk cargo, like grain, ore, and of course, sugar. They feature spacious cargo holds and specialized equipment for efficiently loading, storing, and unloading sugar during transport.
The efficient transportation of sugar relies on a complex network of logistics companies, port facilities, and international maritime regulations.
The Sweetener on Your Table: The Final Destination
Refined sugar reaches consumers through various channels. It's sold directly to households through grocery stores and supermarkets. It's also a key ingredient utilized by food and beverage manufacturers in a wide range of products, from cookies and candies to soft drinks and yogurts. Additionally, sugar finds use in industrial applications, such as pharmaceuticals and biofuels. The final destination of sugar depends on factors like regional preferences – for instance, brown sugar might be more popular in certain regions – and government regulations, such as sugar taxes aimed at reducing consumption.
Beyond the Sweetener: The Ethical Considerations
The global sugar trade has its share of complexities. Concerns around labor practices, environmental impact, and fair trade practices are crucial considerations. The sugarcane industry can be labor-intensive, and ensuring fair wages and working conditions for workers throughout the supply chain is essential. Additionally, sustainable farming techniques that minimize water usage and reduce reliance on chemical fertilizers are becoming increasingly important. Finally, fair trade practices that ensure farmers receive a fair price for their sugarcane contribute to a more responsible and equitable sugar industry.
A Look Ahead: The Future of Sugar
The future of sugar is likely to be shaped by several trends. Growing consumer awareness might lead to increased demand for organic, ethically sourced sugar. Technological advancements in processing could lead to more efficient and sustainable methods of sugar production. Alternative sweeteners may also play a larger role, driven by health concerns. Moreover, the impact of climate change on weather patterns and water availability necessitates adaptation within the sugar industry.
The journey of sugar, from fields to your kitchen, is a complex dance of production, trade, and consumption. While the global sugar market faces challenges like ethical sourcing and climate change, innovation and consumer choices can shape a more productive future. Whether opting for alternative sweeteners or ethically sourced sugar, our collective choices have the power to influence the sustainability and responsibility of this global commodity.

Global Corn Trade and Flow
Corn, also known as maize, is a crucial agricultural commodity that sustains billions and fuels various industries. Its journey from fertile fields to dinner plates and factory lines is a complex choreography of production, transportation, and consumption. Let’s dive into the global corn supply chain, exploring the major players, trade routes, and factors influencing its flow.
The Dominant Producers
According to the United States Department of Agriculture (USDA), the Americas reign supreme in corn production, with the United States (U.S.) leading the way. The fertile "Corn Belt" stretching the Great Plains boasts ideal conditions for corn production, contributing a significant 390 million metric tons to global corn production in the 2023/2024 season.
China, the world's most populous nation, emerges as another significant producer, driven by domestic demand. China produced 289 million metric tons for the 2023/2024 season. Rounding out the top four are Brazil and Argentina, major players in South America. Together, these four countries account for an impressive two-thirds of global corn production.
The Arteries of the Trade
Once harvested, corn embarks on its global journey. Ocean freight remains the dominant mode, with massive cargo ships carrying millions of tons of corn across continents. The United States is forecast to be a major corn exporter in trade year 2023/24, accounting for about a quarter of global corn exports that year. This is based on a projected export of 54 million metric tons, while global trade shipments of corn in trade year 2022/23 amounted to about 180.5 million metric tons.
For regional trade, barges navigate rivers and canals, while railways offer a cost-effective alternative for shorter distances, particularly within large producing countries like the U.S. Trucks play a critical role in the final leg of the journey, delivering corn to processing plants, livestock farms, and export terminals.
Consumer Markets and Demand
The major consumer markets for corn can be categorized into three primary segments: food, feed, and fuel.
• Food: Cornmeal, a coarse flour, is a staple food in many countries, particularly in Latin America and Africa. Corn also serves as an ingredient in various processed foods like breakfast cereals, snacks, and sweeteners.
• Feed: In the U.S., corn is the main feed grain, used in over 95% of all feed grain production and consumption.
• Fuel: The growing demand for biofuels, like ethanol, further increases corn consumption.
The Intricacies of Trade
International trade agreements and government policies significantly impact corn flow. Trade wars and import tariffs can disrupt established trade routes and lead to price fluctuations. Additionally, factors like weather events, crop diseases, and geopolitical tensions can influence supply and demand, impacting global corn prices.
The global corn supply chain is constantly in flux. Technological advancements in farming practices, such as improved seeds and precision agriculture, are boosting yields. The rise of biofuels creates new demand, while concerns about sustainability push for alternative feed options and responsible agricultural practices.
A Look Ahead
The future of the global corn supply chain hinges on several factors. Addressing climate change's impact on agricultural production and ensuring sustainable practices will be crucial. As ethanol manufacturers consume around 40% of the U.S. corn crop, balancing food security needs, exploring alternative protein sources, and ensuring sustainable ethanol production are all critical areas for future consideration.
Conclusion
The global corn supply chain is a complex network that connects farmers, traders, and consumers worldwide. Understanding this intricate network is essential for ensuring food security, efficient resource allocation, and a sustainable future for corn production and consumption.

The Power of Lightness: Why Lithium is Crucial in Our Modern World
Despite its lightness, lithium's exceptional properties - low density, high heat capacity, and strong bonding - make it a crucial part of our modern world. As the demand for clean energy solutions surges, lithium's movement as a commodity has become increasingly volatile, with prices fluctuating based on supply chain constraints and future production expectations. Lithium-ion batteries, dominant in portable electronics and electric vehicles, leverage lithium's efficient ion movement for long-lasting power. Beyond batteries, lithium finds applications in medicine, glass, lubricants, and aerospace alloys.

The future holds even greater promise for lithium as a potential fuel source for clean nuclear fusion energy. However, responsible extraction methods and research into improved battery technology and alternative chemistries are crucial to ensure lithium's continued viability in a clean energy future. As a finite commodity, ensuring efficient use and exploring potential replacements in certain applications will be crucial for managing lithium's role in powering a clean energy future.
A Lightweight Champion: Properties that Make Lithium Special
One of lithium's defining characteristics is its incredibly low density. It's lighter than water, making it ideal for applications where weight reduction is crucial. This low density also translates to high specific heat capacity, meaning it can store a lot of thermal energy for its weight. Additionally, lithium is a highly reactive element, readily forming strong bonds with other elements. These properties combine to create a versatile material with a wide range of applications.
The Reign of the Rechargeable Battery: Lithium's Dominance in Power
Perhaps the most recognizable use of lithium today is in rechargeable batteries. Lithium-ion batteries, the dominant force in powering our portable electronics, laptops, and increasingly, electric vehicles, rely on the movement of lithium ions between electrodes. Lithium's ability to readily store and release these ions makes it the perfect candidate for long-lasting, lightweight batteries.
Lithium-ion batteries have numerous advantages over previous tech innovations. Compared to older battery technologies, they offer higher energy density, meaning they can store more energy in a smaller space. This translates to longer battery life for our devices and extended range for electric vehicles. Additionally, lithium-ion batteries have minimal memory effect, meaning they can be recharged frequently without losing capacity. Their lightweight nature also contributes to the efficiency of portable electronics and electric vehicles.
Lithium, a key player in the clean energy revolution, has become a vital commodity in our modern world. Its role extends far beyond just batteries, finding applications in diverse fields like medicine and materials science. However, it's within the battery realm that lithium truly shines. Its unique properties have fueled the rise of lithium-ion batteries, and with the ever-increasing demand for clean energy solutions, lithium's status as a critical commodity is undeniable. This growing demand can lead to price fluctuations as supply chains adapt, highlighting the need for responsible extraction methods and exploration of alternative sources.
Beyond powering our everyday devices, lithium batteries are making significant strides in larger applications. Grid storage of renewable energy sources like solar and wind power is becoming increasingly important. Lithium-ion batteries offer a viable solution, allowing for the storage of excess energy generated during peak production times for later use. This technology is crucial for integrating renewable energy sources into our power grids and reducing reliance on fossil fuels.
Beyond Batteries: Diverse Applications of Lithium
Lithium's impact extends beyond its dominant role in batteries, finding applications in diverse fields including medicine and materials science:
Medicine: Lithium carbonate is a well-established medication used to treat bipolar disorder. It helps regulate mood swings and improve overall mental well-being.
Glass and Ceramics: Lithium oxide is added to glass and ceramics to improve their strength, durability, and heat resistance. This is particularly important for applications in cookware and telescope lenses.
Lubricants: Lithium-based greases are widely used in high-temperature and high-pressure applications. Their ability to withstand extreme conditions makes them ideal for machinery and automotive components.
Metal Alloys: Lithium is a key component in lightweight alloys used in the aerospace industry. These alloys combine strength with minimal weight, making them crucial for building fuel-efficient aircraft.
Nuclear Fusion: Lithium isotopes are a potential fuel source for nuclear fusion reactions, a clean and potentially limitless energy source of the future. While still under development, this technology holds immense promise for meeting our future energy needs.
The Challenges and Future of Lithium
The growing demand for lithium, particularly for electric vehicles and battery storage, has raised concerns about resource availability and environmental impact. Lithium is not a rare element, but extracting it in a sustainable and responsible manner is crucial. Recycling existing lithium batteries and exploring alternative extraction methods are essential for the long-term viability of this critical resource.
The future of lithium research is also focused on improving battery technology. Scientists are constantly working on developing new materials and electrode designs to increase energy density, improve charging times, and enhance battery safety. Additionally, research into alternative battery chemistries that could potentially replace lithium-ion technology is ongoing.
Conclusion: A Bright Future Powered by Lithium
Lithium's unique combination of properties has secured its place as a critical element in our modern world. The responsible management of this essential commodity is crucial, requiring sustainable extraction methods, exploration of alternative sources, and continued research into improved battery technology and alternative chemistries.
From powering our devices to shaping the future of transportation and energy production, lithium's importance is undeniable. As we continue to explore its potential and address the challenges associated with its extraction and use, lithium is poised to play a vital role in building a more sustainable and technologically advanced future.

Where Are U.S. Soybeans Going?
The United States is a major producer and exporter of soybeans, a versatile crop that is used in a variety of foods and industrial products. In 2023, the United States exported a staggering $27.94 billion worth of soybeans, solidifying its position as a global leader in soybean production and trade.

China: The Leading Market for U.S. Soybeans
China is the dominant importer of U.S. soybeans. In 2023, China purchased $15.16 billion worth of U.S. soybeans, accounting for 54% of the total export value. This dominance can be attributed to several factors, including China's massive population and growing demand for protein-rich foods like meat and poultry. Soybeans are a key ingredient in animal feed, and China's booming livestock industry relies heavily on U.S. soybean imports to meet its needs.
The trade relationship between the U.S. and China regarding soybeans has been complex in recent years. The imposition of tariffs between the two countries caused some disruption in the soybean trade. However, the situation has since stabilized, and China remains a vital market for U.S. soybean producers.
The European Union: A Strong and Steady Soybean Importer
The European Union (EU) is another major destination for U.S. soybeans, importing $3.61 billion worth of the crop in 2023. The EU's demand for soybeans is driven by factors similar to those in China, such as a large population and a growing meat production industry. Additionally, the EU uses soybeans for a variety of other purposes, including the production of vegetable oil and biodiesel.
The EU market is particularly attractive for U.S. soybean exporters due to its relative stability and predictability. The EU has a long history of importing soybeans from the U.S., and there are well-established trade channels in place. This makes it easier for U.S. exporters to reach the EU market and to build strong relationships with European buyers.
Mexico: A Growing Market for U.S. Soybeans
Mexico is a rising star in the world of U.S. soybean imports. In 2023, Mexico purchased $2.78 billion worth of U.S. soybeans, making it the third-largest importer. This growth can be attributed to Mexico's expanding livestock sector and its increasing demand for high-quality feed ingredients.
The proximity of Mexico to the U.S. is another factor that contributes to the strong soybean trade between the two countries. Transportation costs are lower when compared to shipping soybeans to more distant markets, making U.S. soybeans a more attractive option for Mexican buyers. Additionally, Mexico and the U.S. have a long history of trade cooperation, which further strengthens the soybean trade relationship.
Beyond the Top Three: Other Important Markets for U.S. Soybeans
While China, the EU, and Mexico are the top destinations for U.S. soybeans, several other countries play a significant role in the U.S. soybean export market. These include Japan, Indonesia, Taiwan, Egypt, Vietnam, Bangladesh, and South Korea. These countries import soybeans for a variety of purposes, including food production, animal feed, and industrial applications.
The diversification of U.S. soybean exports is important for the long-term health of the industry. It reduces reliance on any single market and helps to mitigate risks associated with fluctuations in demand from individual countries. Additionally, expanding into new markets creates new opportunities for U.S. soybean producers and helps to boost the overall value of U.S. soybean exports.
The Importance of U.S. Soybean Exports
The U.S. soybean export industry plays a critical role in the American economy. It creates jobs for farmers, transportation workers, and others involved in the agricultural sector. It also generates revenue that helps to support rural communities. Additionally, U.S. soybean exports contribute to the country's overall trade balance.
Beyond the economic benefits, U.S. soybean exports also play a role in global food security. Soybeans are a valuable source of protein, and U.S. exports help to meet the food needs of a growing world population. By supplying high-quality soybeans to other countries, the U.S. helps to ensure that people around the world have access to nutritious and affordable food.

The US Shale Boom: A Tripling of Production and Its Impact
The American shale gas industry has undergone a period of phenomenal growth, witnessing a staggering 12-fold increase in production over the last decade. This surge, driven by advancements in hydraulic fracturing technology, has fundamentally reshaped the US energy landscape with far-reaching consequences.

A Production Surge: Unlocking Shale's Potential
Shale gas refers to natural gas trapped within layers of shale rock. Traditionally, extracting this gas was challenging due to the rock's low permeability. However, the advent of hydraulic fracturing, or fracking, revolutionized the industry. This technique involves injecting high-pressure fluids into the rock formations, fracturing them, and releasing the trapped gas.
This technological breakthrough unlocked vast reserves of shale gas across the United States. States like Texas, Pennsylvania, and Louisiana emerged as major shale gas producers. The US Energy Information Administration (EIA) reports that shale gas production in the US reached a staggering 34.8 trillion cubic feet (Tcf) in 2020, a remarkable feat considering production was only around 10 Tcf in 2000.
Reshaping the Energy Landscape: The Price Effect
The shale boom's most prominent impact lies in its influence on energy prices. The influx of abundant natural gas into the market led to a significant decline in natural gas prices. According to the Bureau of Labor Statistics, natural gas prices fell substantially by 56.8% between 2007 and 2012, largely due to the surge in shale gas production.
This price drop had a ripple effect across various sectors. Cheaper natural gas translates to lower electricity generation costs for power plants that can switch between fuels. Additionally, industries that rely on natural gas as a fuel source, such as manufacturing and fertilizer production, benefitted from reduced costs. Ultimately, these cost savings trickled down to consumers, who enjoyed lower energy bills.
The Geologic Shift: US Energy Independence
The increase in US shale gas production has significantly impacted the nation's natural gas trade. Before the shale boom, the United States imported a substantial portion of its natural gas. However, the surge in domestic production has led to a decrease in these imports.
This shift in gas trade has potential geopolitical implications. Reduced reliance on imports may lessen the US's vulnerability to price fluctuations in the global market and potential tensions with major gas-exporting countries. Additionally, the US's role as a natural gas producer could influence international energy dynamics and potentially lead to new strategic partnerships.
The Road Ahead: Balancing Growth and Sustainability
The shale gas boom has undeniably transformed the US energy landscape. It has driven down energy prices, enhanced energy security, and created new jobs. However, environmental concerns necessitate a cautious approach. Balancing responsible resource extraction with robust environmental regulations is paramount.
Technological advancements in areas like methane capture and wastewater treatment can significantly mitigate the environmental impact of fracking. Additionally, investing in renewable energy sources can create a more sustainable energy mix for the future.
Conclusion
The doubling of US shale gas production since 2000 is a story of technological innovation and its far-reaching consequences. The shale boom has reshaped the energy landscape. As the industry navigates the future, a commitment to responsible practices and technological advancements will be crucial in ensuring its long-term sustainability.

Fueling the World: Canada's Top Export Commodities
Canada is a major player in global trade. From the icy plains rich in minerals to the sprawling forests teeming with lumber, Canada exports a diverse range of commodities that contribute significantly to the world's economy. We delve into Canada's top ten export products, highlighting their importance and exploring the intricate dance between resource extraction and economic development.

1. Crude Oil: The Engine of Industry ($120.58 billion)
Unquestionably, Canada's king of exports is crude oil. The vast oil sands deposits in Alberta fuel this dominance, making Canada the world's fourth-largest exporter of crude oil. This viscous oil requires extensive processing to become usable fuel, contributing to the downstream industries of refined petroleum products like gasoline and diesel (which you'll see later on our list). The global demand for energy, particularly in developing economies, continues to drive strong crude oil prices, making it a significant revenue generator for Canada.
2. Petroleum Gases: Fueling Homes and Industries ($23.12 billion)
Natural gas, another hydrocarbon bounty of Canada, exists alongside crude oil deposits. Processed and exported in gaseous form, these petroleum gases find application in various sectors. Homes use them for heating, while industries leverage their clean-burning properties for power generation. The increasing demand for cleaner alternatives to coal makes natural gas a valuable export commodity for Canada.
3. Processed Petroleum Oils: Refining the Raw into Usable Fuel ($17.04 billion)
Remember the crude oil mentioned earlier? It undergoes a complex refining process to create usable fuels like gasoline, diesel, and jet fuel. These refined petroleum oils are lighter and more versatile than crude oil, making them essential for transportation and other industrial applications. Canada's robust refining infrastructure allows it to transform its crude oil wealth into these in-demand products for export.
4. Gold: A Timeless Treasure ($14.97 billion)
Canada's mineral wealth extends beyond hydrocarbons. The country is a leading producer of gold, a precious metal coveted for its beauty, durability, and industrial applications. Canadian gold mines, particularly concentrated in Ontario and Nunavut, extract this valuable resource. Unwrought gold, meaning gold in its purest form before being crafted into jewelry or other products, is a significant export, finding its way to international markets for further processing and trade.
5. Potash Fertilizer: Nourishing the World ($12.63 billion)
Canada, blessed with vast potash deposits, is a major player in the global fertilizer market. Potash, a potassium-rich mineral, is essential for plant growth. Canadian potash mines, primarily located in Saskatchewan, extract and refine this crucial nutrient, ensuring healthy crops and bountiful harvests around the world. This export commodity plays a vital role in global food security.
6. Sawn Wood: Building with Strength and Sustainability ($10.91 billion)
Canada's vast forests are a source of high-quality lumber. Sawn wood, referring to timber that has been cut into planks or beams, is a major export commodity. From framing materials for houses to furniture and construction projects, Canadian sawn wood is prized for its strength, versatility, and increasingly, its sustainable forestry practices.
7. Coal & Solid Fuels Made from Coal: Powering Industries ($10.83 billion)
Coal, a traditional source of energy, remains a significant export for Canada. While concerns about its environmental impact are driving a shift towards cleaner alternatives, coal still finds application in power generation and industrial processes. Canada exports both thermal coal, used for electricity production, and metallurgical coal, essential for steel production.
Beyond the Numbers: A Look at the Future
Canada's export landscape is constantly evolving. While traditional resource-based exports remain strong, the country is also focusing on diversifying its offerings. The rise of clean technology and the growing demand for sustainable practices are opening doors for new export opportunities.
If you’re a commodity trading professional searching to gain new insights and solutions, join the Kontango waitlist to see why we’re the best commodity trading platform in the world.
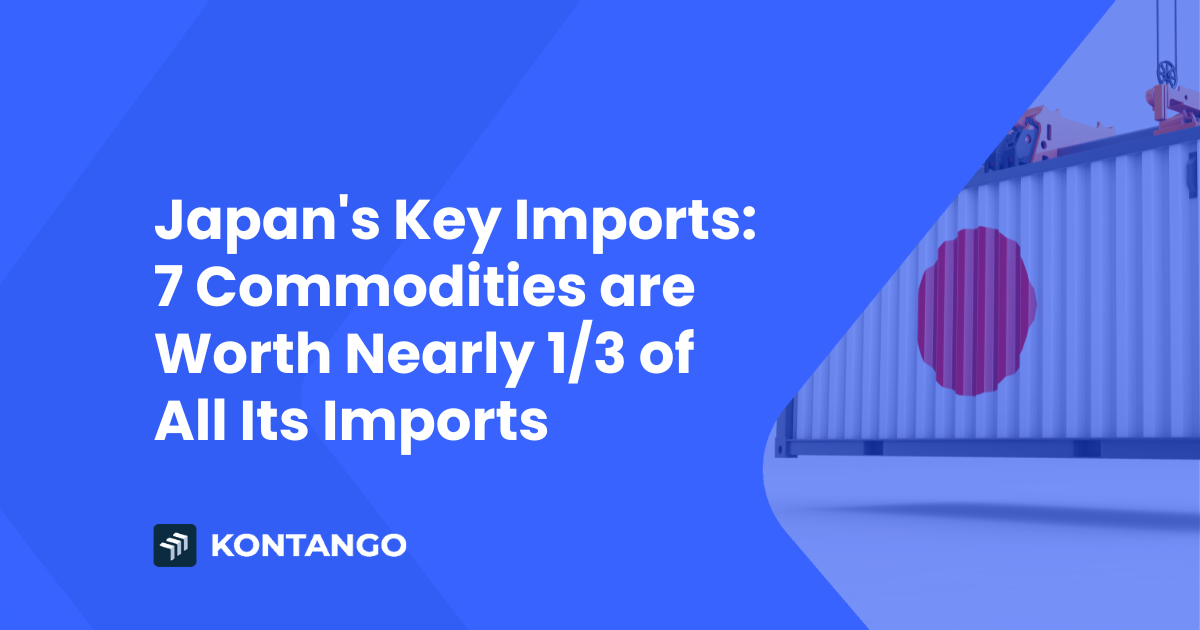
Japan's Top 7 Commodity Imports
Based on data from OEC, the top seven imported commodities for Japan, with a reported value of $256 billion, account for over 31% of their total imports.

From powering its cities and infrastructure to driving its various industries forward, the top seven imported commodities are the silent engines of Japan's progress. For commodity traders across the world, paying attention to Japan’s macro-economic decisions provides insights into where their economy might be going in the future.
Let's take a look at each of the top seven imported commodities from 2022 (unless otherwise noted for their volume noted by year) that are pivotal to Japan's growth and showcase the goals and needs of Japan in the greater economy.
Crude Petroleum: $86.7B (158.64 Kilolitres)
Crude petroleum is the lifeblood of Japan's economy, with the country spending $86.7 billion on it in 2022, becoming the 5th largest country of imported or crude petroleum in the world. This resource fuels not only vehicles and industries but also plays a crucial role in Japan's energy security. As oil prices are always fluctuating, Japan's reliance on crude petroleum shows the importance of strategic energy planning. The country's heavy dependence on oil imports makes it vulnerable to global market volatility, emphasizing the need for diversification and investment in alternative energy sources.
Petroleum Gas: $64.2B (10.55 million metric tons)
Japan's investment in petroleum gas, amounting to $64.2 billion, again highlights its role as a key energy source. Utilized for heating, and electricity generation, and as a feedstock for the petrochemical industry, petroleum gas is a big player in Japan's energy portfolio. Its significance is set to increase as Japan seeks cleaner alternatives to coal. The shift towards natural gas reflects Japan's commitment to reducing its carbon footprint and embracing a more sustainable energy future.
Coal Briquettes: $53.7B (180.34 million metric tons)
Despite their intentions to shift towards renewable energy, coal briquettes remain a key part of Japan's energy demand, with imports valued at $53.7 billion. As the world’s 2nd largest importer of coal briquettes, they provide a reliable source of power, especially in the face of natural disasters that can disrupt other energy supplies. However, the environmental impact of coal usage is an ongoing concern for Japan's sustainable future.
Refined Petroleum: $18.7B (147.66 million kiloliters in 2023)
Refined petroleum, with an import value of $18.7 billion, is essential for Japan's transportation and industrial sectors. It powers everything from cars to machinery, playing an important role in keeping the nation's economy moving smoothly.
Copper Ore: $12.4B (4,959,310,000 Kg (2021))
Copper ore, with $12.4 billion in imports, is a critical component of Japan's technological advancements. Its conductive properties make it necessary for building electronics, wiring, and renewable energy technologies, reinforcing Japan's position as a leader in innovation and technology. Their investment in copper shows its commitment to technological development and meeting the demands of its highly advanced manufacturing sector.
Iron Ore: $11.3B (104.2 million metric tons)
Iron ore, the foundation of the steel industry, is another key import for Japan, amounting to $11.3 billion. Steel is crucial for infrastructure, automotive manufacturing, and various other industries, making iron ore an essential part of Japan's industrial success.
Platinum: $9.48B (52 tons)
Platinum, with $9.48 billion in imports, is an important element in producing automotive catalytic converters and electronic devices. Its role in reducing vehicle emissions and powering technology is a testament to its importance in Japan's commitment to environmental sustainability and technological innovation.
Japan’s Changing Economy in the Future
Looking towards the long-term future, Japan is known as one of the most rapidly aging and declining populations in the world. As their economy continues to evolve alongside their aging population, their demand for various commodities will continue to change too. It’s important for commodity traders to pay close attention to the changing demands of Japan.
And as the world’s third largest economy after the United States and China, Japan’s top seven imported commodities are shown to be building blocks of its economy and the drivers of its technological advancement. Their large demand for natural resources, such as crude petroleum and natural gas, makes them a crucial player to watch each and every year.
If you’re looking to optimize your commodity trading strategies and understand key market shifts, Kontango offers a cutting-edge platform designed for you to be efficient at your job. With real-time, data-driven trading optimization and innovative tools like market mapping and trade planning, Kontango is your partner in navigating the ever-changing world of commodity trading.
Discover how Kontango can transform your trading experience. Join the waitlist today.

Always in Kontango #9 • Freda Gordon & Fiona Boyd, Acuity Commodities
Freda Gordon and Fiona Boyd, of Acuity Commodities', unpack the complexities of sulfur and sulfuric acid markets in episode 9 of Always in Kontango. These unique commodity markets, shaped by factors like byproducts and regional variations, offer valuable lessons for those navigating the global commodity landscape.
Niche Markets with Global Impact
Sulfur and sulphuric acid play a crucial role in various industries. Sulfur finds application in fertilizers, creating the sulfuric acid needed for battery production, and even in pharmaceuticals. Sulphuric acid, a highly versatile industrial chemical, is essential in sectors like fertilizers, metal processing, and water treatment.
Despite their niche status, these markets have a significant global impact. The fertilizer industry, a major consumer of both sulfur and sulphuric acid, is critical for ensuring global food security. Understanding the intricacies of these markets empowers stakeholders across the agricultural value chain to make informed decisions.
Byproduct Bonanza: A Supply Chain Twist
One of the defining characteristics of the sulfur market is its dependence on other industries as a byproduct. Most sulfur originates from the refining of crude oil, with natural gas processing and volcanic deposits contributing smaller quantities. This inherent link to other industries creates a unique supply dynamic.
A surge in oil production can lead to increased sulfur output, potentially influencing market prices. Conversely, a decline in oil exploration activities can tighten sulfur supplies, pushing prices upwards.
The Inelasticity Enigma: When Demand Doesn't Budge
Another intriguing aspect of the sulfur and sulphuric acid markets is their inelasticity. This economic term refers to the limited responsiveness of demand to price fluctuations. In simpler terms, even if prices rise, the demand for these essential commodities remains relatively stable.
The inelasticity of these markets stems from their irreplaceable role in various industries. Fertilizer manufacturers, for instance, cannot readily switch to alternative ingredients without compromising the effectiveness of their products. This inelasticity can create a certain level of stability in pricing, but it can also make the markets susceptible to supply disruptions.
Regional Variations: A Global Market with Local Flavors
This episode highlights the significant regional variations within the sulfur and sulphuric acid markets. Factors like transportation costs, local production capacities, and environmental regulations can influence prices and trade flows in specific regions.
An example is how the abundance of sulfuric acid production in China can impact global pricing, while transportation costs can play a major role in determining the competitiveness of imported sulfur in certain regions.
Challenges and Opportunities: A Look Ahead
Environmental regulations aiming to curb sulfur emissions from fuels are expected to impact future demand patterns. Additionally, the growing demand for fertilizers in developing economies is likely to influence both sulfur and sulphuric acid consumption.
On the opportunity front, advancements in technology for sulfur extraction and processing hold promise for increased efficiency and potentially lower costs. The rising focus on battery production, a significant consumer of sulfuric acid, could also present new growth avenues for the market.
The Acuity Advantage: Unlocking Market Intelligence
Acuity Commodities, through its team of dedicated sulfur and sulphuric acid experts, offers valuable insights to navigate this complex market landscape. Their expertise in data analysis, combined with their understanding of the unique dynamics at play, empowers market participants to make informed decisions.
Conclusion
This episode of Always in Kontango with Acuity Commodities offers a glimpse into the world of sulfur and sulphuric acid. Despite their lesser-known status, these niche markets are important across various industries. Understanding their unique characteristics, from byproduct dependence to regional variations, empowers stakeholders to navigate the complexities of these markets and capitalize on emerging opportunities. With Acuity's market intelligence as a guide, industry professionals can gain a competitive edge and make informed decisions in this dynamic and ever-evolving landscape.

Crippling Collapse: Key Bridge Disaster Disrupts Commodity Flow
The recent collapse of the Key Bridge, a vital transportation artery on the East Coast, has sent shockwaves through the American economy. Beyond the immediate human cost and infrastructure challenges, the incident poses a significant threat to the nation's supply chain, particularly for commodities like coal and soybeans. Baltimore is a key hub for warehousing base metals (aluminum, copper, zinc) and ferroalloys, but its importance goes beyond that. The port is also the top US terminal for handling road vehicles and boasts large volumes of agricultural commodities (coffee, sugar).

The Key Bridge served as a critical link for transporting goods between major production centers and distribution hubs. Trucks carrying coal mined in Pennsylvania and West Virginia, for example, relied on the bridge to reach power plants and export terminals along the Atlantic coast. Similarly, soybean harvests from the fertile Midwest often traversed the Key Bridge on their way to processing facilities and international ports.
The bridge's collapse has created a major bottleneck in these crucial transportation routes. Trucks are now forced to take detours, adding significant time and distance to their journeys. This translates to:
Increased Transportation Costs: Longer routes mean higher fuel consumption and vehicle wear and tear. These additional costs will likely be passed on to consumers through price hikes for coal and soybeans.
Delivery Delays: The disruption to established schedules can lead to delays in delivering coal to power plants, potentially impacting electricity generation. Soybean shipments to international buyers could also face delays, jeopardizing trade agreements and impacting foreign markets.
Spoilage Risk: For perishable goods like soybeans, extended travel times increase the risk of spoilage, leading to potential product loss and economic waste.
The impact on the coal industry is particularly concerning. Coal-fired power plants operate on tight schedules, and a disruption in coal supply can force them to scramble for alternative sources. This scramble could drive up the price of coal, impacting electricity costs for consumers and businesses.
The soybean industry, a major American export, also faces challenges. Delays in getting soybeans to ports could lead to missed deadlines for international contracts. This could damage the reputation of American exporters and potentially lead to lost business in the long run.
The consequences of the Key Bridge collapse extend beyond immediate disruptions. Here's a breakdown of potential long-term effects:
Shifting Trade Routes: Businesses may seek alternative transportation routes, potentially leading to a permanent shift in how commodities move across the country. This could have unforeseen consequences for infrastructure needs in other regions.
Investment in Infrastructure: The collapse highlights the need for investment in aging infrastructure like bridges. This could increase government spending on infrastructure projects, creating jobs but potentially impacting budgets elsewhere.
Rise of Alternative Energy: Delays in coal delivery could incentivize power plants to explore alternative energy sources like natural gas or renewables. This could accelerate the transition away from coal-fired power generation.
The federal government, state authorities, and the private sector need to work together to mitigate the impact of the Key Bridge collapse. Here are some potential solutions:
Emergency Repairs: Repairing the Key Bridge should be a top priority. Expedited construction with minimal safety compromises can help restore normal traffic flow as soon as possible.
Temporary Solutions: Utilizing ferries, barges, or even temporary bridges could offer short-term relief by facilitating limited transportation of essential goods across the affected area.
Financial Assistance: Government intervention may be necessary to help businesses cope with the increased costs and delays associated with rerouting their shipments.
Long-Term Infrastructure Planning: The Key Bridge incident should serve as a wake-up call to invest in infrastructure upgrades and preventative maintenance for critical transportation links across the country.
The collapse of the Key Bridge is a stark reminder of the interconnectedness of the American economy. While the immediate focus lies on rescue efforts and rebuilding the bridge, addressing the long-term consequences of this disaster is crucial. By implementing effective solutions and prioritizing infrastructure investment, the nation can build a more resilient supply chain and mitigate future disruptions.

Always in Kontango #8: Part 2 with Nderim Rudi from Tratics
In the 8th episode of Always in Kontango host Christian Callender-Easby dives into an enlightening conversation with Nderim Rudi, the founder and CEO of Tratics, a company specializing in rail rate management software.
You can listen here or wherever you get your podcasts.
The discussion offers valuable lessons and insights for commodity traders looking to optimize their logistics and gain a competitive edge in the market.
Here are the key takeaways for commodity traders:
- Perseverance in Starting a Company: Nderim shares his journey of starting Tratics, emphasizing the importance of perseverance. He made four attempts before successfully launching the company, highlighting that persistence is crucial in overcoming obstacles and achieving success.
- Innovating in a Traditional Industry: Tratics brings innovation to the old-world, analog supply chain industry by offering a software solution that simplifies rail rate management. This innovation is crucial for traders looking to streamline their logistics and reduce manual processes.
- Customization and Adaptability: Tratic’s ability to customize its software according to specific customer needs sets it apart in the industry. This adaptability ensures that traders can integrate the software seamlessly into their existing workflows and processes.
- Real-time Data and Estimates: The software provides real-time estimates and keeps track of negotiated rates and tariffs, which is vital for traders to make informed decisions quickly and stay competitive in the market.
- The Importance of Support: Nderim highlights the importance of having supportive people in your life, such as family and spouses, who can provide encouragement and stability during the challenging journey of entrepreneurship.
- Navigating Enterprise Sales: The discussion sheds light on the challenges of enterprise sales, including long sales cycles and legal complexities. Nderim's experience underscores the importance of patience and persistence in navigating these hurdles.
To gain more insights and learn from Nderim Rudi's experience in innovating the supply chain industry with Tratics, listen to the full episode of "Always in Kontango" on Spotify, Apple Podcasts, or wherever you listen to podcasts.
This episode is a must-listen for commodity traders and anyone interested in the intersection of technology and supply chain management.

The Impact of Severe Drought in the Panama Canal on Global Commodities
Ever since its completion in 1914, the Panama Canal has been crucial for international trade, providing the first-ever shortcut for trade between the Atlantic and Pacific Oceans.

But at the start of this year, the water level for the Panama Canal is the lowest it's ever been for the start of dry season, meaning that way less ships can pass through the canal. One of the big issues was that Gatún Lake, forming a key stretch of the canal system and giving fresh water to the canal, saw little rain in 2023, as El Niño triggered a drought.
Due to this severe drought, the Panama Canal Authority (PCA) has lessened daily traffic going through the canal by nearly 40%, compared to the start of 2023. But they expect a rainier season this year following El Niño and hope to return to normal levels soon.
The Panama Canal accounts for 5% of all seaborne trade, which includes 46% of the cargo traffic between the East Coast of the United States and Northeast Asia. They are also reducing the amount that each ship is able to carry. Because of taking the drastic measures of reducing traffic, toll revenues have dropped $100 million per month since October.
Such measures, while necessary in the short term, disrupt the flow of goods across the globe, from natural gas to grains and other bulk commodities.
A Ripple Effect on Global Trade
The immediate fallout from these restrictions leads to increased shipping costs and a less efficient supply-chain. Business across the world, the Panama Canal and the country of Panama, commodity traders, and ultimately consumers in supermarkets are feeling the pain of these restrictions.

Shipments from the United States to Asian markets have faced major disruptions, given the Panama Canal's role as a critical shortcut, pushing up prices on these commodities, such as natural gas and grain, and adding many more weeks to the time it takes to ship goods.
Many companies, especially those shipping fuels from the US Gulf Coast to Asia, are willing to pay a high price tag, as high as $4 million, in order to reserve a spot sending their ships through the Panama Canal. For context, at the start of 2023, the auction price for this reservation was just $173,000. Because of these high shipping costs, consumers will see a trickle-down effect on the price of goods back home.
Other companies are opting to not pay $4 million and travel instead via the Suez Canal or Cape of Good Hope. These routes add thousands of miles to a ship’s journey and more than a week at sea.
But the impact of the Panama Canal's restrictions extends beyond just the physical transportation of commodities. It also affects commodity trading, as traders navigate the challenges posed by delays and uncertainty in supply chains.
The Panama Canal’s Impact on Commodities
Commodity traders must now factor in the risk of canal-related disruptions when making trading decisions. This adds a layer of complexity to an already volatile market, as they must anticipate and mitigate the effects of potential delays on their trading activities.
Here are a few commodities, most affected by the drought in the Panama Canal.
1. Oil
The Panama Canal plays a pivotal role in the transportation of oil, serving as a key route for the shipment of crude oil from the United States to Asia. With draft restrictions in place, ships are unable to carry their usual capacity, leading to delays in the delivery of oil. This disruption has the potential to impact global oil prices, as supply chains are strained by the reduced capacity of the canal.
2. Grains
Grains, including wheat and corn, are also heavily affected by the canal's draft restrictions. The United States is a major exporter of grains to Asia, relying on the Panama Canal for efficient transportation. Delays in the delivery of grains can have far-reaching trickle-down effects on consumers.
3. Minerals
The transportation of minerals, such as iron ore and coal, is another area where the Panama Canal plays a crucial role. South America is a significant producer of minerals destined for Asian markets, and any disruption in the canal's operations can lead to delays in delivery.
Economic and Environmental Implications of the Drought
The drought's impact goes beyond immediate trading concerns, touching on economic and environmental themes. The situation underscores the interconnectedness of global trade and climate change, showing how critical trade routes are vulnerable to environmental shifts.
There's also a concern about the potential reshaping of global trade dynamics. As the Panama Canal faces extreme water scarcity, alternative routes and shipping methods gain traction, possibly altering trade patterns and economic power balances in the long term.
Looking Ahead: Mitigating Risk and Ensuring Resilience on the Panama Canal
The PCA is exploring investments in new technological and infrastructural improvements to improve the canal's resilience to drought. One major candidate for ways to add more water to the Panama Canal is to build a new reservoir on the Indio River, west of Gatún Lake.
They’ve also considered using Bayano Lake to the east as a reservoir, but it would involve sending the water many miles away from a reservoir that also supplies Panama City with important resources.
As the PCA considers new options, the broader challenge of climate change remains critical, requiring international cooperation and innovation to improve, create new trade routes, and consider what the next 50 years may look like for the future of trade.
Diversifying transportation routes across the world, saving up on essential commodities (or finding a way to acquire them in your own country), are just some of the strategies that can help mitigate the risks posed by the droughts in Panama.
This drought is a reminder of the fragility of global supply chains and how important the Panama Canal is for these systems.
If you're interested in staying updated on developments in the world of commodity trading, consider joining the waitlist for Kontango, the leading platform for commodities professionals.
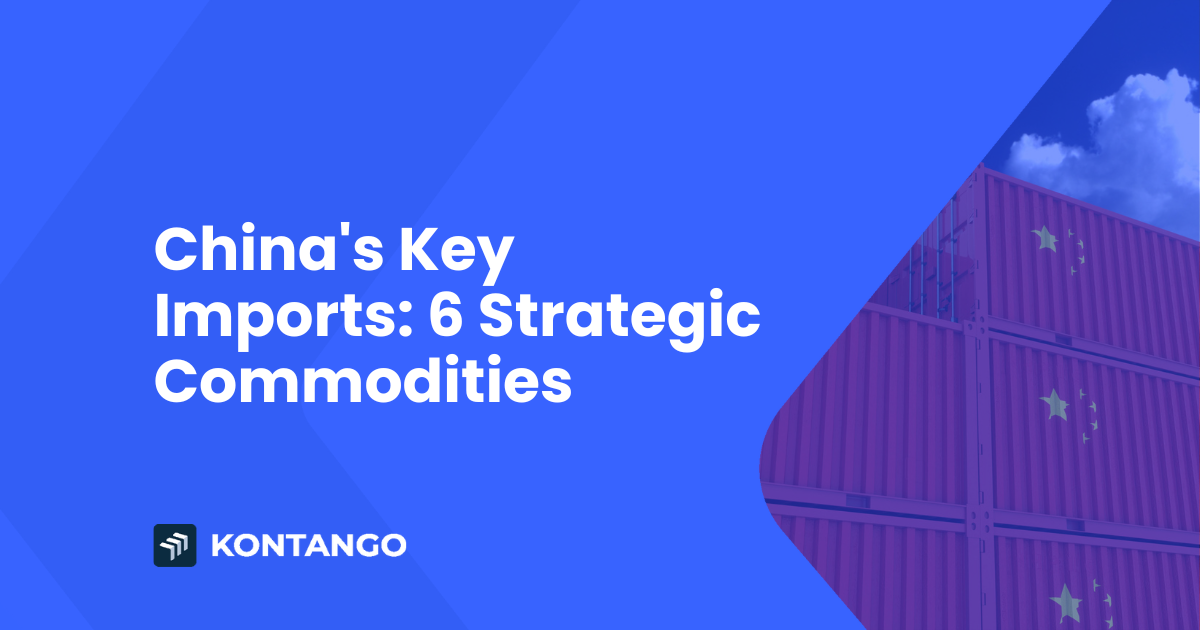
China's Key Imports: 6 Strategic Commodities
Based on a report from World’s Top Exports, China's portfolio of imported goods, a beacon of its economic strategy, highlights six commodities that cumulatively form a substantial $778 billion, a figure representing 29% of its total imports.

From oil and gas to copper and iron, China imports the second most goods every year in the entire world. Let’s dive deeper into the significance of these six commodities, showcasing their critical roles in China's economy.
Crude Oil: $366B
Dominating the import charts for China, crude oil's $366B footprint in China's economy is a clear indicator of its indispensable role as fuel has become more and more important for them. This staple of energy not only powers the nation's vast industrial sector but also meets the energy needs of its burgeoning urban landscapes. Furthermore, the amount of oil imported into China has grown 41% year-over-year, showing how much the need for crude oil grew during the global pandemic. This reliance on crude oil underscores China's growing industrialization and modernization, reflecting its status as a global economic powerhouse hungry for energy resources.
Iron Ores and Concentrates: $128B
Iron ore imports, valued at $128B, are the lifeline of China's steel production, which in turn, fuels its construction boom and manufacturing prowess. But the 30% decrease year-over-year in imports of iron shows that the importance of manufacturing in China is waning. However, this investment in iron ore reflects China's strategic focus on infrastructure development and its ambition to maintain supremacy in global steel production, a sector pivotal for its economic growth and international trade dominance.
Petroleum Gases: $91B
Petroleum gasses, with an import value of $91B, are another cornerstone of China's energy strategy. Their growth of 48% year-over-year again shows the importance of gasoline for the powering of Chinese infrastructure. These gasses play critical roles across various sectors, from heating homes and powering industries to being key feedstocks for the petrochemical industry. Their import highlights China's multifaceted approach to energy security and its reliance on diverse energy sources to fuel its economic engine.
Gold (Unwrought): $77B
With $77B of gold imports, showing a 62% increase from last year, it signifies more than just a transaction; it embodies China's strategic financial planning. By bolstering its gold reserves, China not only diversifies its investment in their central bank but also fortifies its economic stability, showing a prudent approach to safeguarding its economic future against global financial uncertainties.
Soya Beans: $61B Agricultural Necessity and Trade Dynamics
Soya beans, crucial for both human consumption and as feed in China's massive livestock industry, represent a $61B import segment, a 14% increase year-over-year. This reflects China's interdependence with global agricultural markets and underscores the importance of securing a stable food supply chain, vital for its population and burgeoning food and meat industry.
Copper Ores and Concentrates: $56B The Conductor of Modernization
Importing $56B worth of copper ores and concentrates, a modest 1% decrease from the previous year, China secures a fundamental resource for its electrical and electronic industries. Copper's pivotal role in infrastructure, technology, and renewable energy sectors mirrors China's ambitions in technological advancement and modernization, aligning with its vision for a future-oriented economy.
The Future of China’s Demand on the Global Economy
As the world’s second largest economy, and leader for imports such as crude oil, iron ore, soybeans, and copper ore, China’s growth doesn’t seem to be slowing down any time soon.
In January and February 2024, according to AP, imports rose 3.5% for China, compared to 0.2% growth in December, while the trade surplus was $125B. This growth beat estimates, showing that demand may be improving as Beijing continues to speed up its economic recovery from the pandemic.
If you’re a commodity trading professional searching for a new solution, join the Kontango waitlist to see why we’re the best commodity trading platform in the world.

Kontango at The Fertilizer Institute (TFI) Conference: Optimism and Opportunity in the Fertilizer Industry
Kontango recently participated in the The Fertilizer Institute conference from February 26th to 28th, engaging with industry leaders and gaining valuable insights into the fertilizer market. The conference provided a platform to connect with over a dozen leading companies, generating new interest in Kontango's trade planning and market intelligence platform.
Market sentiment at the conference was notably optimistic, fueled in part by the early arrival of spring weather, which has already set the product in motion in the South. This early start to the spring fertilizer season has been met with enthusiasm, particularly among medium to large fertilizer producers, distributors, traders, and retailers.
One key takeaway from the conference was the industry's eagerness to begin optimizing team efforts and planning. Kontango's platform, known for its trade planning and market intelligence features, was particularly well-received, with attendees expressing a strong need for such tools in the industry.
A major highlight was the opportunity to meet with 20 companies across various sectors of the fertilizer industry. Discussions ranged from market trends and challenges to potential collaborations and partnerships. The overall mood was positive, with many expressing excitement for a strong season ahead. However, there were also concerns about the season potentially ending earlier than usual, which could impact logistics and procurement strategies.
One notable challenge highlighted during discussions was the risk associated with buying vessels from abroad, especially when the timing is crucial to meet the demands of the planting season. Delays in shipment and delivery could lead to disruptions in the supply chain, affecting farmers' ability to apply fertilizer in a timely manner.
The conference also revealed a growing interest among teams to explore CRM platforms and other technologies to enhance commercial relationships. This indicates a broader trend within the industry towards leveraging technology for improved efficiency and collaboration.
Kontango's presence at the TFI conference was a success, with fruitful discussions, new connections, and a reaffirmation of the industry's need for innovative solutions. As the fertilizer season gains momentum, Kontango remains committed to supporting its partners with cutting-edge tools and insights to navigate the market with confidence.
Get in touch with us at Kontango to discover how our solutions can benefit your business.

Always in Kontango #7 • Nderim Rudi, Tratics
In this seventh episode of “Always in Kontango”, we speak with Nderim Rudi, CEO and Founder of Tratics, a supply chain management platform for North American rail shippers that we're excited to have as a technology partner.
Episode #7: https://open.spotify.com/episode/71BTajqRKcoHhWSzWw8bIn?si=416a3ee84d944214
Our recently established partnership with Tratics enables the integration of their competitive rail rate data service with Kontango's suite of commodity trading solutions. This collaboration leads to the development of data products and commercial planning solutions that leverage the advantages of our respective proprietary data. Ultimately, this allows us to deliver pioneering tools that optimize supply chains in the industry.
A native of Kosovo, Nderim recalls how his teenage years during the war, marked by his family’s hardships and experience as refugees, instilled in him the enduring values of resilience and perseverance. He explains his parents' beliefs on the importance of education and hard work, and his learnings from his uncle's business experiences.
Nderim pursued his undergraduate studies in agriculture and finance at the American College of Thessaloniki in Greece, then earned a graduate degree in applied economics at Virginia Tech in the United States.
His career in the railroad industry began at Norfolk Southern, one of the major Class 1 railroads in the US. He describes his early days learning about market research and economics, as well as gaining exposure to high-level decision-making in planning and strategy. After seven years at Norfolk Southern, he became an expert in railroad pricing and optimization, having acquired valuable expertise throughout his tenure.
He went on to join the Surface Transportation Board in Washington, D.C. as an industry analyst , an experience that provided him with valuable insights into the regulatory landscape of the railroad industry. He explains the complexities of railroad mergers and the role of regulatory agencies in overseeing industry practices.
Nderim highlights the unique dynamics of the railroad industry, including the significant influence of large corporations, such as Class 1 railroads, on employees' career paths. He describes the allure of stable employment within these corporations, characterized by competitive salaries and attractive benefits, which often deter individuals from venturing into entrepreneurship.
Join us as Nderim shares the driving forces behind his decision to explore entrepreneurship, including a desire for greater autonomy and a sense of fulfillment beyond traditional corporate roles. He discusses how personal experiences prompted him to re-evaluate his priorities and take calculated risks in pursuing entrepreneurial endeavors.
Podcast: https://open.spotify.com/show/4M0wXNIvCDA8HB7WHtBVf0?si=38339c2525df4dc0
Always in Kontango #7: https://open.spotify.com/episode/71BTajqRKcoHhWSzWw8bIn?si=416a3ee84d944214
In this episode: Nderim Rudi (CEO & Founder, Tratics), Christian Callender-Easby (Founder & CEO, Kontango)

Brazil’s Top 10 Commodities Are Worth More Than Half of All Its Exports
Centuries of agricultural development have transformed Brazil into a global powerhouse. Indigenous communities had cultivated essential crops like cassava, maize, and beans for millennia, establishing a foundation for future agricultural development. In the 16th century, European colonization introduced sugarcane, transforming the landscape and economy. Sugarcane plantations dominated Brazil's exports for centuries, shaping its colonial era.
During the 17th and 18th centuries, tobacco emerged as a major export crop for Brazil, particularly in the South and Southeast regions. Its popularity and export value made it a significant source of income and fueled economic growth. Cotton cultivation also gained traction during this period, especially in the North and Northeast. This export crop offered high potential due to growing demand, contributing to Brazil's economic diversification.
Coffee plantations flourished in the 19th century, making Brazil the world's leading producer and fueling economic growth. The 20th century brought further diversification, with soybeans, oranges, and beef joining the export roster. Technological advancements and land expansion propelled Brazil's agricultural output, solidifying its position as a global powerhouse.
Between 2000-2012, Brazil was one of the fastest-growing major economies in the world, with an average annual GDP growth rate of over 5%. According to the International Monetary Fund (IMF) data for 2023, Brazil has the 9th largest nominal GDP in the world, at $2.126 trillion, and the 8th largest purchasing power parity globally, with a value of $4.101 trillion.
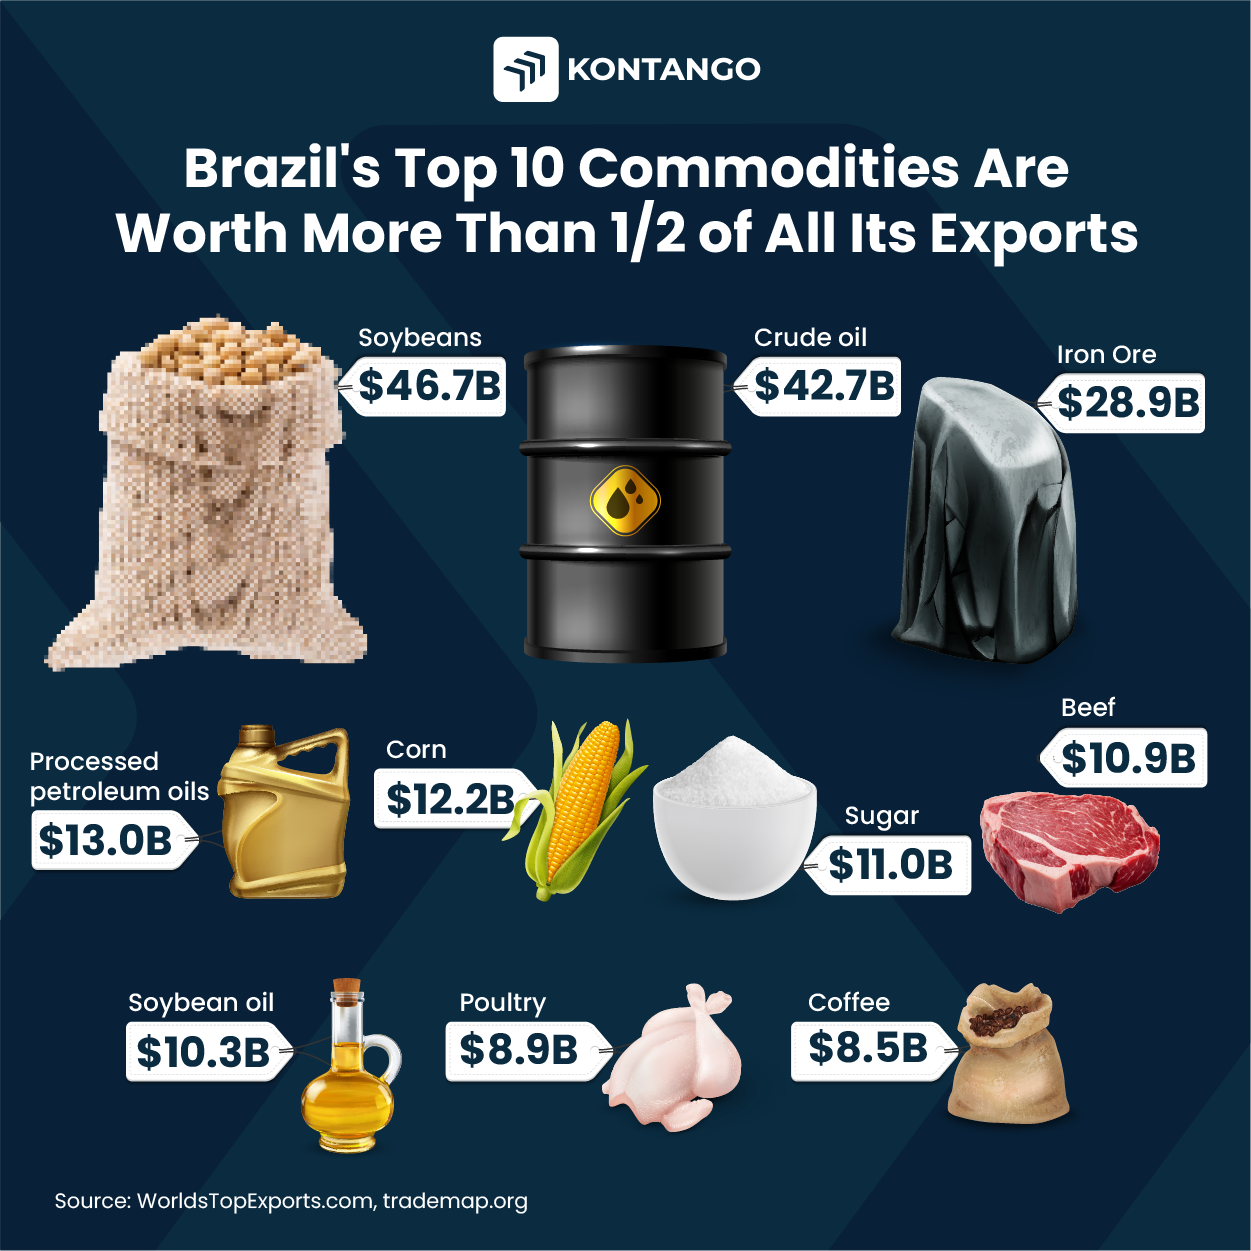
Rich in natural resources, Brazil is a major exporter of over 200 agricultural products. Its ten most valuable commodities alone make up 57% - or $193B - of its total export value, which reached $334B in 2022:
1. Soybeans • $47B: Vast, fertile plains in central Brazil, dubbed the "Matopiba region," form the heart of this booming agribusiness. Mechanized farms efficiently cultivate these protein-rich legumes, feeding a growing global demand.
2. Crude Oil • $43B: Deep below the ocean surface off Brazil's southeastern coast lies the Presalt Basin, a treasure trove of crude oil. Advanced technology allows extraction even from these challenging depths, contributing significantly to the national economy. international markets.
3. Iron Ore • $29B: The mineral-rich hills of Minas Gerais state hold the key to this resource. Large-scale mines extract the iron ore, fueling the global steel industry with this vital raw material.
4. Processed Petroleum Oils • $13B: Taking crude oil a step further, Brazil boasts sophisticated refineries that transform it into gasoline, diesel, and other fuel products, meeting domestic needs and contributing to exports.
5. Corn • $12B: Similar to soybeans, corn finds its home in the expansive central plains. Often grown in rotation with soybeans, this versatile grain serves as animal feed and a key ingredient in various food products.
6. Sugar • $11B: The lush sugarcane fields of São Paulo state tell a story of centuries-old tradition. Modern farming techniques combined with efficient processing plants keep Brazil at the forefront of global sugar production.
7. Beef • $11B: From sprawling cattle ranches in the Cerrado savanna to feedlots in southern states, Brazil is a major beef producer. Bovine meat exports find their way to international markets, satisfying appetites worldwide.
8. Soybean Oil • $10B: A byproduct of processing soybeans, this versatile oil finds uses in cooking, food manufacturing, and even biofuels. Its production further elevates the economic value of Brazil's massive soybean harvest.
9. Poultry • $9B: Modern poultry farms across the country, particularly in southern states, contribute to this rapidly growing export sector. Chicken meat production meets both domestic and international demand, showcasing Brazil's agricultural diversification.
10. Coffee • $8.5B: The rolling hills of southern Minas Gerais, birthplace of iconic brands like Arabica and Robusta, continue to produce some of the world's most beloved coffee beans. Traditional farming methods and modern processing techniques ensure premium quality exports.
In conclusion, Brazil's centuries-long evolution as an agricultural and resource powerhouse has secured its position as a dominant force in the global market. Its remarkable rise is further highlighted by its impressive global rankings: the ninth-largest nominal GDP and the eighth-largest purchasing power parity worldwide according to IMF data for 2023. Furthermore, the dominance of Brazil's top 10 commodities, contributing over half of its exports, stands as a testament to the nation's commodity export prowess. From soybeans and crude oil to processed petroleum oils and coffee, Brazil's broad portfolio of exports reflects its rich natural resources and innovative agricultural practices. Looking ahead, Brazil's economic strength and resource wealth offer a promising trajectory for continued global influence and prosperity.

10 Countries Control 67% of Global Coffee Export Value
Coffee, the aromatic fuel that powers countless mornings and creative afternoons, has a rich and storied history dating back to the 9th century in Ethiopia. From its humble beginnings in the Horn of Africa, coffee has transformed into a globally significant commodity over centuries. Its cultivation and trade provide livelihoods for millions across the world, with smallholder farmers nurturing beans and bustling export hubs facilitating international commerce. Today, a handful of countries dominate the global coffee industry, accounting for a staggering 67% — or $31 billion — of the world's coffee export value, which totaled $46 billion in 2023. From sprawling Brazilian plantations to Germany's meticulous roasting techniques, each nation weaves a distinct thread into the rich tapestry of coffee's journey from bean to brew.

1. Brazil • $8.5B:
Reigning supreme is Brazil, where vast, fertile plains nurtured by a warm, tropical climate produce nearly a third of the world's coffee. Lush, rolling hills are dotted with endless rows of primarily Arabica trees, their emerald hues symbolizing the lifeblood of this South American giant. While large-scale plantations contribute significantly to Brazil's dominance, smaller, family-owned farms also play a crucial role, often specializing in organic and shade-grown varieties prized for their unique flavor profiles.
2. Colombia • $4.1B:
Nestled amidst the majestic Andes Mountains lies Colombia, renowned for its shade-grown coffee production. This unique practice fosters biodiversity, enriches the soil, and contributes to the exceptional flavor profiles of Colombian beans. Smallholder farmers are the backbone of this industry, meticulously hand-picking their prized Arabica beans, often passed down through generations. Sustainability and fair trade practices are deeply ingrained in Colombian coffee culture, ensuring ethical sourcing and environmental responsibility.
3. Switzerland • $3.4B:
While Switzerland doesn’t grow coffee itself, its strategic location and expertise in logistics and finance have earned it the title of the global coffee trading hub. Swiss companies act as the bridge between producers and consumers worldwide, importing, blending, and re-exporting vast quantities of beans. Their meticulous attention to detail and quality control ensure that only the finest coffees reach international markets.
4. Germany • $3.4B:
Germany has a long and passionate history with coffee, reflected in its vibrant cafe culture and renowned roasting expertise. German companies import a diverse range of beans, carefully roasting them to create unique flavor profiles that captivate consumers worldwide. From light and fruity roasts to dark and bold blends, German roasters cater to a wide spectrum of palates, pushing the boundaries of coffee artistry.
5. Vietnam • $3.2B:
Southeast Asia's Vietnam emerges as the world's leading producer of Robusta coffee beans, known for their strong, bold flavor and higher caffeine content. Thriving in fertile highlands on intensive, productive farms, Vietnamese coffee plays a significant role in the global market.
6. Italy • $2.4B:
Italy, the birthplace of espresso, fuels its passion for coffee with high-quality Arabica imports, primarily from Central and South America. Italian roasting techniques and meticulous brewing methods have shaped the iconic espresso enjoyed worldwide. From the creamy texture of a perfectly pulled shot to the intricate art of latte art, Italian coffee culture embodies a dedication to craftsmanship and sensory experience.
7. Honduras • $1.7B:
Nestled in the mountainous regions of Central America, Honduras is home to small, family-owned farms that contribute significantly to the global coffee market. These farms often cultivate diverse microclimates and high-altitude growing conditions, resulting in Honduran coffee's balanced flavor profile with notes of chocolate and citrus. Fair trade initiatives and sustainable practices are gaining momentum in Honduras, empowering local communities and ensuring responsible coffee production.
8. Ethiopia • $1.5B:
Ethiopia, the cradle of coffee cultivation, boasts ancient coffee forests harboring unique heirloom varieties prized for their floral and fruity notes. Smallholder farmers cultivate these precious beans using traditional methods, preserving the heritage and biodiversity of coffee's origins.
9. Belgium • $1.5B:
Strategically located in the heart of Europe, Belgium serves as a key import and re-export hub for coffee. Its port cities receive and distribute beans from various origins, catering to the diverse preferences of European consumers. This location facilitates the accessibility of specialty coffees across the continent, powering a vibrant European coffee culture.
10. United States • $1.2B:
Despite not growing its own coffee, the United States ranks as a major importer and consumer, with a vibrant cafe culture and diverse coffee preferences. American consumers drive demand for a wide range of coffees, from specialty single-origin beans to convenient, on-the-go options.
Conclusion
Ten countries dominate the global coffee export market, collectively generating 67% of its value. From Brazil's large farms to Colombia's careful cultivation methods, each nation adds its own touch to the coffee experience. Switzerland serves as a global hub, while Germany's expertise in roasting enhances flavor profiles. Vietnam specializes in Robusta beans, and Italy's love for espresso influences coffee culture worldwide. Smaller players like Honduras and Belgium also contribute significantly, showcasing the significant role of family farms and strategic trade routes in the global coffee industry. Coffee cultivation supports millions globally, especially in Ethiopia, its birthplace. The vast reach of the coffee industry emphasizes the global impact of this beloved beverage.

10 Countries Produce 96% of Palm Oil Worldwide
Palm oil, an edible vegetable oil derived from the fruit of palm trees, serves as a staple component in a wide range of consumer goods—found in everything from processed food items to cosmetics, soaps, and even biofuels. Indigenous to West Africa, palm oil cultivation has expanded globally, with worldwide production of palm oil steadily climbing for the last fifty years. Between 1995 and 2015, annual production quadrupled, surging from 15.2 million tons to 62.6 million tons. By 2050, it is projected to quadruple again, reaching an estimated 240 million tons. With global demand for palm oil on the rise, below is a breakdown of the top 10 countries that collectively contribute an enormous 96% of the world's palm oil, in metric tons:

1. Indonesia - 47 Million:
Topping the list is Indonesia, the undisputed heavyweight in the palm oil industry. With vast plantations spread across Sumatra and Borneo, Indonesia is the largest global producer. The lush landscapes of Kalimantan and Sumatra serve as the primary source for the cultivation of palm oil, fueling the nation's robust palm oil industry.
2. Malaysia - 19 Million:
A close contender to Indonesia, Malaysia stands as the second-largest producer of palm oil globally. The country's thriving palm oil industry thrives in the states of Sabah and Sarawak, located on the island of Borneo. Malaysian palm oil is renowned for its high quality and is a vital component in the country's economic landscape.
3. Thailand - 3.5 Million:
Thailand’s southern regions, including provinces like Krabi and Surat Thani, are key contributors to Thailand's palm oil production. Thai palm oil is recognized for its quality, and the industry plays a pivotal role in the nation's agricultural sector.
4. Colombia - 1.9 Million:
South America's representative in the top palm oil producers, Colombia, has steadily increased its palm oil output. Vast plantations stretch across the country, with regions like Meta and Cesar playing crucial roles. Colombia's palm oil industry has been a key driver of economic growth, providing employment opportunities and fostering development.
5. Nigeria - 1.5 Million:
In West Africa, Nigeria stands out as a prominent player in the palm oil arena. With plantations scattered across states like Cross River and Akwa Ibom, Nigeria has established itself as a crucial contributor to global palm oil production. The industry also holds significant cultural importance, reflecting the nation's rich agricultural heritage.
6. Guatemala - 0.9 Million:
The fertile landscapes of Guatemala’s Petén region contribute significantly to the country's palm oil production. Guatemala's palm oil sector has faced challenges related to sustainability, prompting efforts to balance economic gains with environmental concerns.
7. Papua New Guinea - 0.8 Million:
In the Pacific region, Papua New Guinea has emerged as a notable palm oil producer. The industry thrives in provinces like West New Britain and Oro, where expansive plantations dot the landscape. Papua New Guinea's palm oil sector faces ongoing discussions about sustainable practices and environmental conservation.
8. Ivory Coast - 0.6 Million:
In West Africa, Ivory Coast contributes significantly to global palm oil production. The humid climates of regions like San Pedro and Sassandra create optimal conditions for palm oil cultivation. The industry plays a crucial role in the country's economy, providing employment and driving economic growth.
9. Honduras - 0.6 Million:
Central America's second representative, Honduras, has steadily increased its palm oil output. The industry has gained traction in areas like Colón and Gracias a Dios, where plantations thrive. Honduras faces the challenge of balancing economic gains with environmental sustainability, a common concern in the palm oil sector.
10. Brazil - 0.59 Million:
Rounding off the list is Brazil, a newcomer to the top palm oil producers. The country's palm oil industry has experienced growth in regions like Pará and Maranhão. Brazil's entry into the global palm oil market has brought attention to sustainable practices, with efforts to balance economic development with conservation gaining momentum.
Conclusion
In conclusion, these ten nations serve as the key players in the global palm oil industry, collectively responsible for 96% of the world's production. Palm oil is a ubiquitous ingredient found in countless products used by billions worldwide every day, but meeting the ever-growing demand often comes at a cost - deforestation. Driven by its versatility and low cost, palm oil production surged, often at the expense of irreplaceable ecosystems.
According to a World Wide Fund for Nature report, it’s estimated that up to 300 football fields - or 160 hectares - of forest are cleared every hour to make room for palm plantations. This rapid deforestation disrupts habitats, pushes countless species towards extinction, and releases vast amounts of carbon dioxide, further fueling climate change. While progress towards sustainable practices is underway, the scars of past deforestation serve as a stark reminder of the delicate balance we risk upsetting in our pursuit of convenience.

Always in Kontango #6 • Mark Behrman, LSB Industries
In this sixth episode of "Always in Kontango," we sit down for a compelling discussion with Mark Behrman, President & CEO of LSB Industries.
Episode #6: https://spotifyanchor-web.app.link/e/07JygQfg0Gb
Mark’s career journey has taken him from the fast-paced world of Wall Street to the helm of a thriving chemical manufacturer.
Mark grew up in Commack, NY, where sports and Boy Scouts played an important part in shaping his leadership skills. He studied accounting at Binghamton University and earned an MBA in finance from Hofstra University. His early interest in Wall Street was sparked by family friends working in finance at the time.
He began his financial career as a Managing Director for Bluestone Capital Partners, later holding key roles at prestigious firms such as Sterne Agee, PaineWebber, and Drexel Burnham Lambert. His arrival at LSB Industries in 2014 marked the culmination of a remarkable thirty-year career in financial services.
Mark shares how he has always been drawn to the industrial sector, fascinated by the tangible aspect of businesses involved in creating products for consumers. He shares his thoughts on the importance of decisive decision-making in the commodity markets, and the need for teams to be confident in their choices, avoiding the pitfalls of second-guessing. Drawing a parallel between a producer's mindset and that of a trader, Mark highlights the necessity of understanding the unique considerations involved in the production of commodity chemicals.
Join us in this episode as we hear Mark discuss the importance of building quality management teams and share his perspective on a decade of executive leadership at LSB Industries, which he views in two very distinct phases, each with its own set of challenges and considerations.
Podcast: https://open.spotify.com/show/4M0wXNIvCDA8HB7WHtBVf0?si=46d6db8afd43421d
Always in Kontango #6: https://spotifyanchor-web.app.link/e/07JygQfg0Gb
In this episode: Mark Behrman (President & CEO, LSB Industries), Christian Callender-Easby (Founder & CEO, Kontango)